Catalog Overlap & Price Positioning Charts
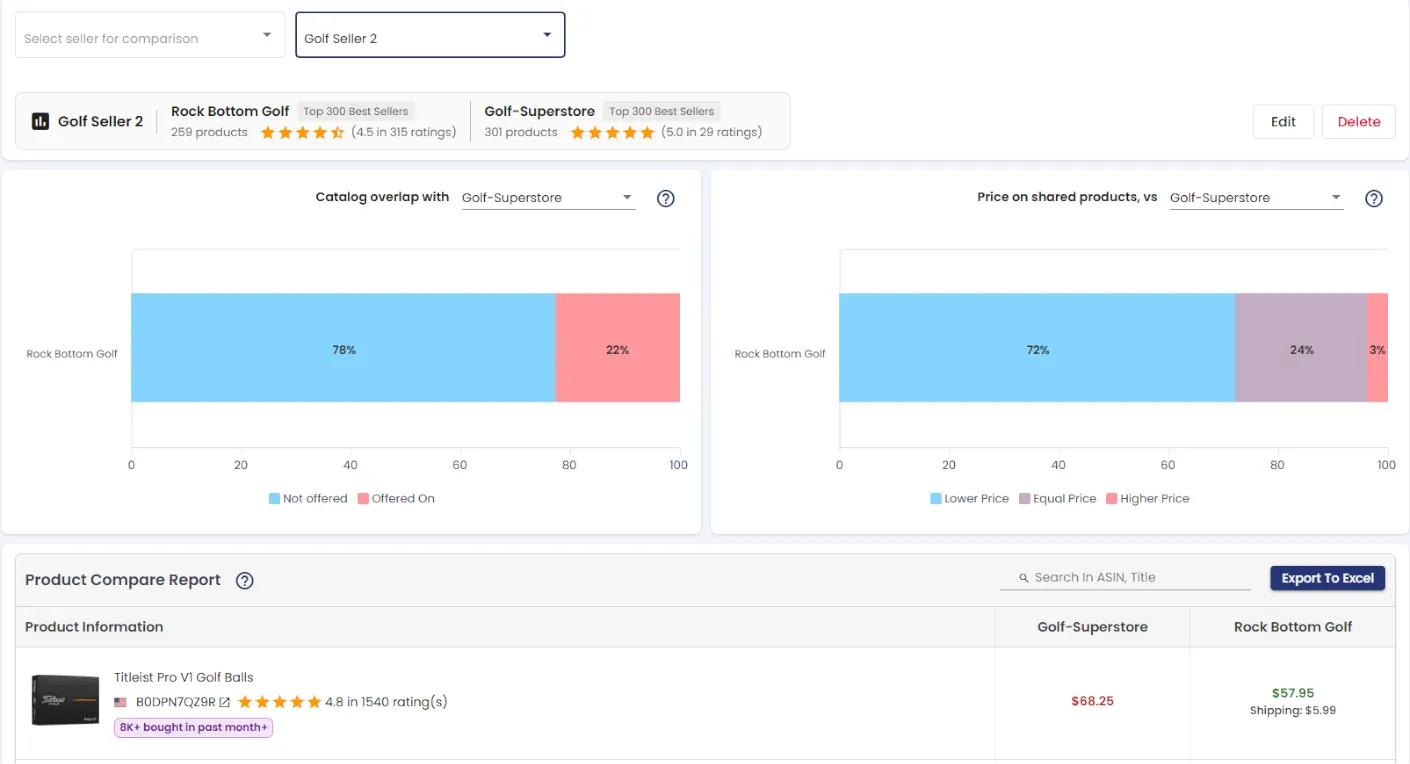
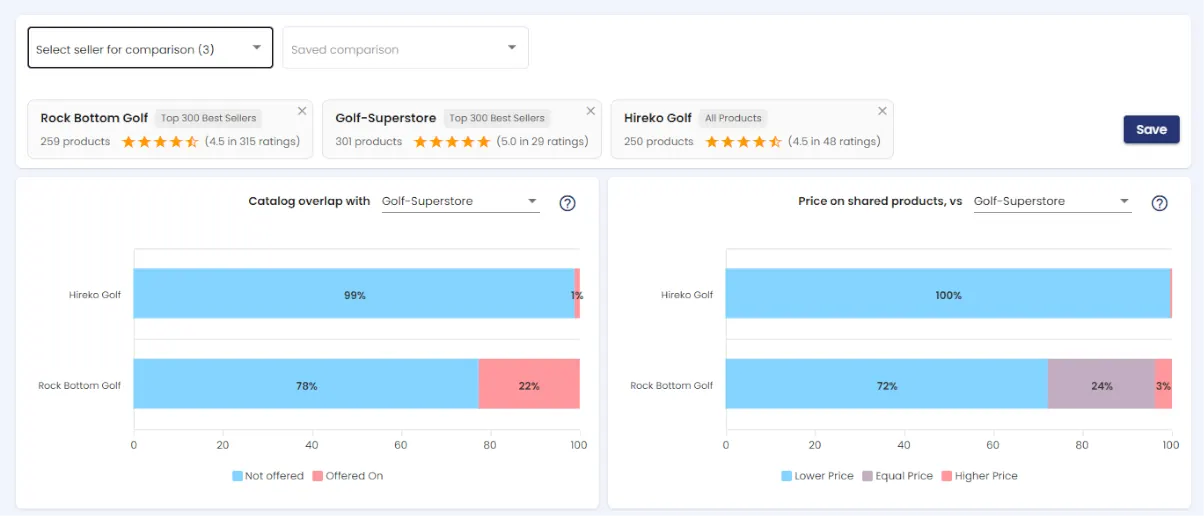
Both charts sit side by side and read from the same seller selection above them, so there's nothing to configure separately for each one — pick a reference seller from the dropdown, and both charts update together to reflect the current comparison. Add or remove a seller from the comparison, or switch the reference seller, and both refresh immediately to match — you never need to rebuild one chart after changing the other.
The Catalog Overlap chart shows, for each other seller in the comparison, what percentage of the reference seller's promoted catalog they also carry. Hover over a bar to see the exact number of overlapping products, or click it to list out the matching ASINs.
The Price Positioning chart works on that same overlapping set — the products the reference seller has in common with each other seller — and shows what share of them are priced higher versus lower. In other words, it's a price breakdown of exactly the products counted in the Catalog Overlap chart: the first tells you how much catalog two sellers share, the second tells you who's undercutting whom on that shared portion, without opening a single listing.
Product Compare Table
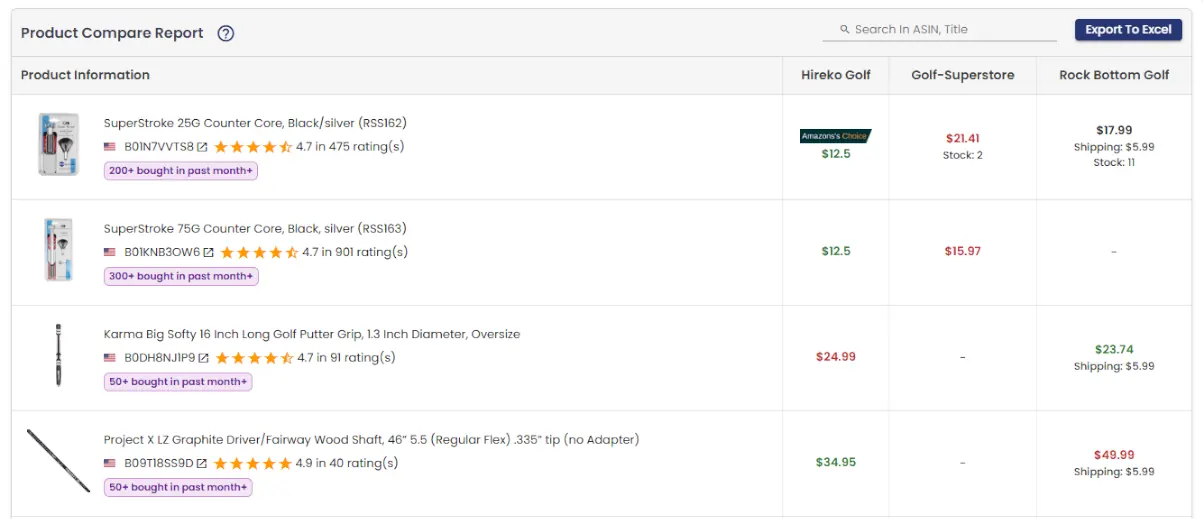
Below the charts, every shared and unique product gets its own row, with one column per seller in the comparison — price, shipping, stock, an FBA tag, any active deal or coupon, and the Amazon's Choice badge, all side by side. The lowest and highest price in each row is highlighted automatically so the best (and worst) offer jumps out. Paginate through the full list or export the table to Excel.
Saving a Comparison
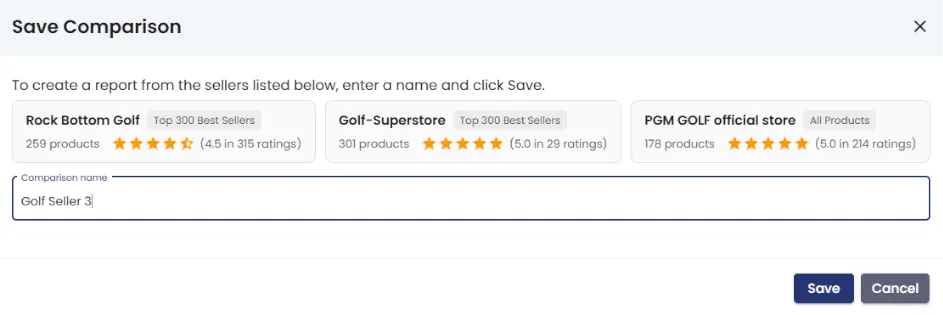
Found a combination of sellers you check regularly? Click Save to name it and store it as a saved comparison — it'll be waiting for you in the Saved comparison dropdown next time, no need to re-select sellers. From a saved comparison you can Edit the seller list or Delete it entirely whenever your priorities change.